
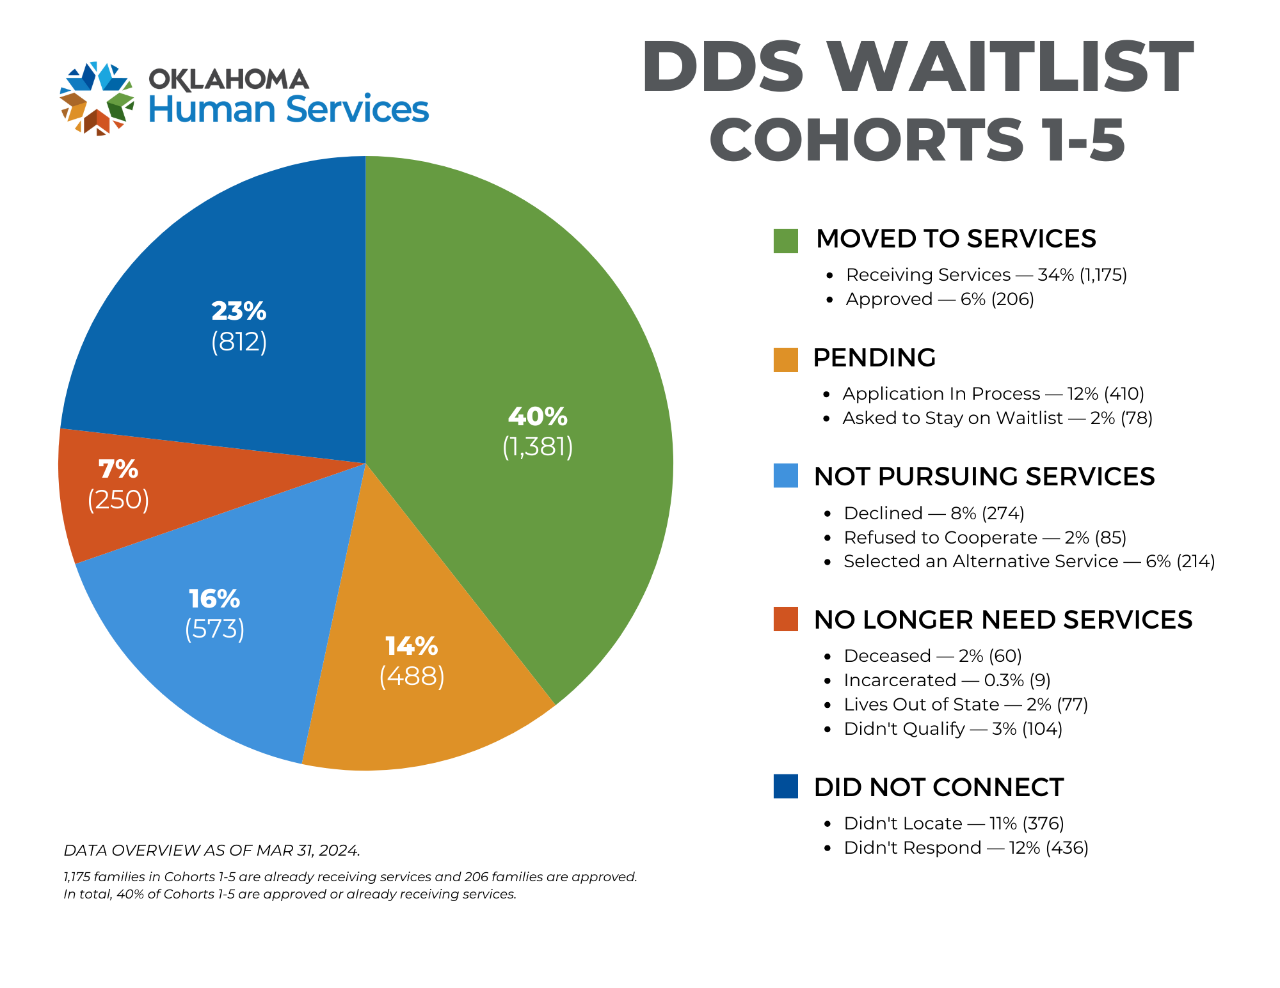
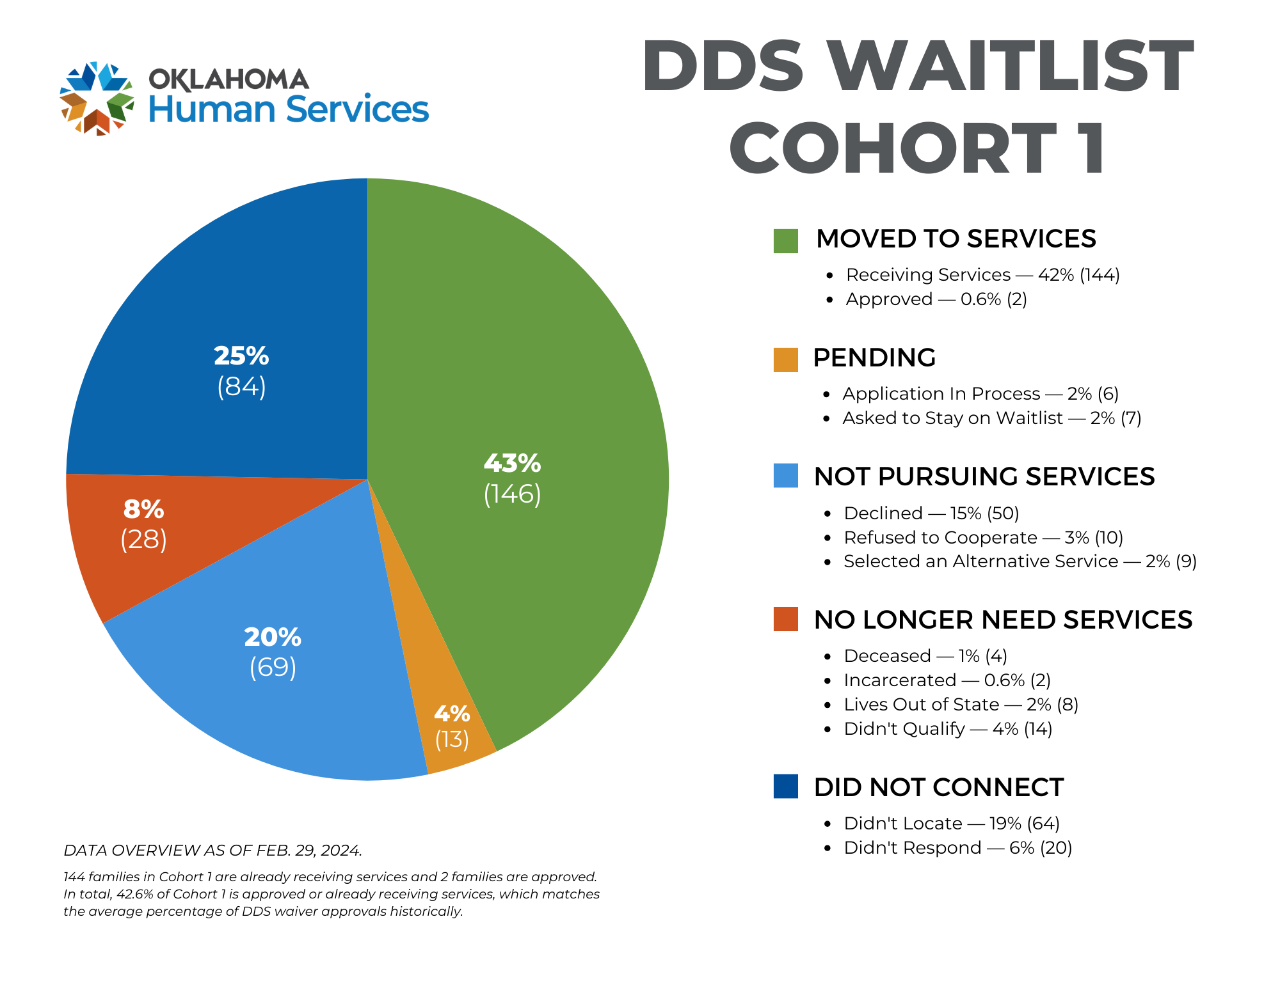
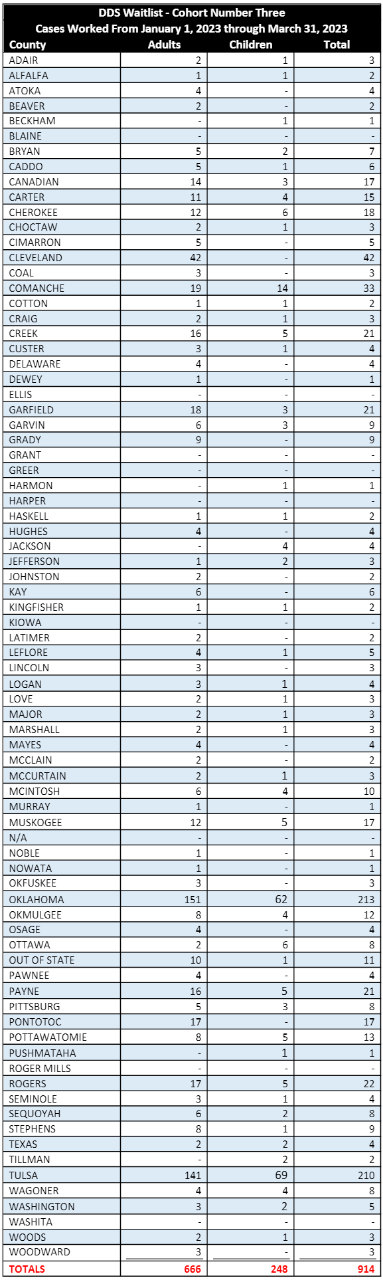
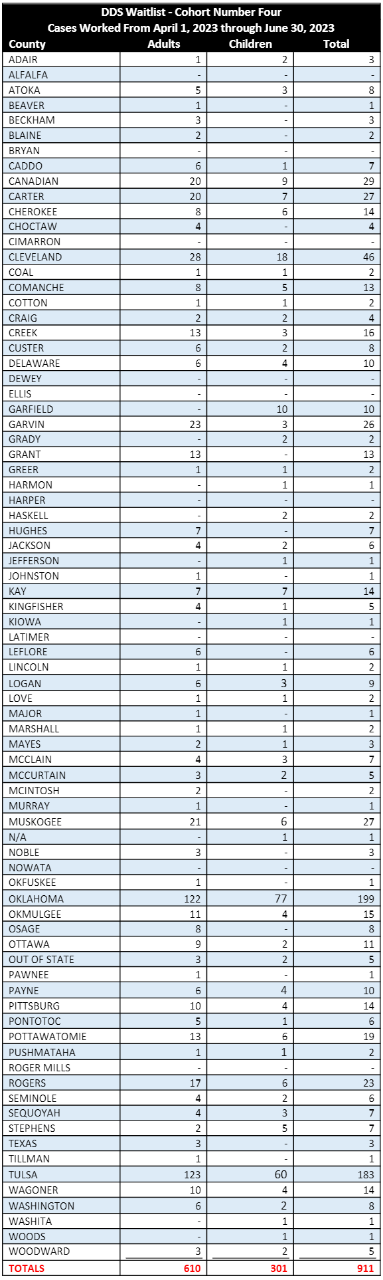
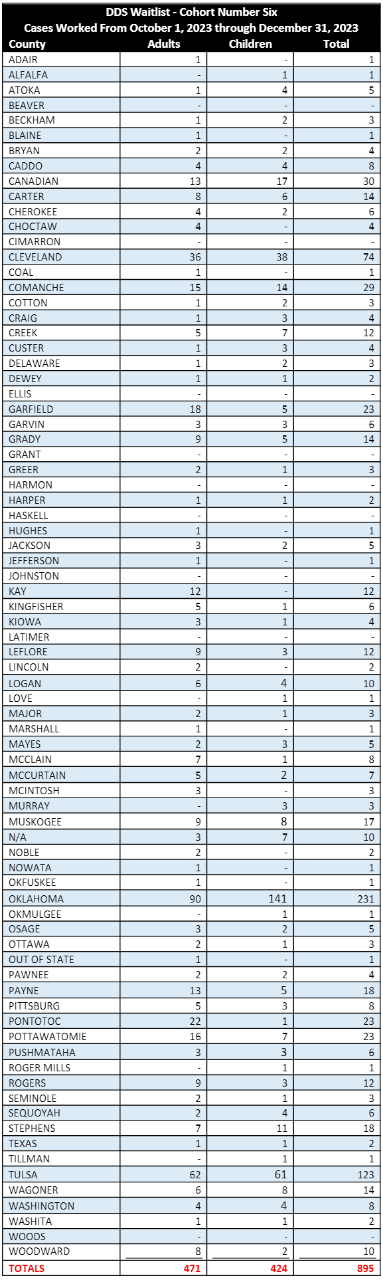
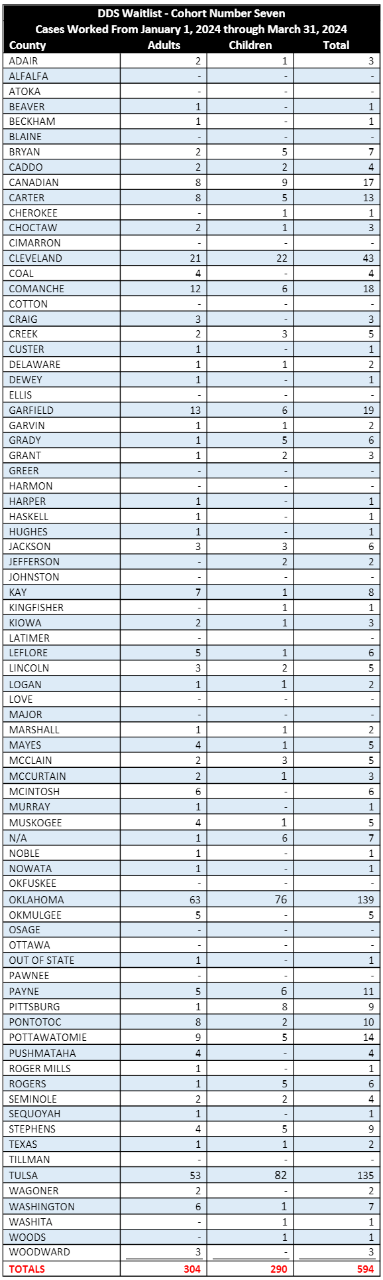
Cohorts 1 - 5 Data
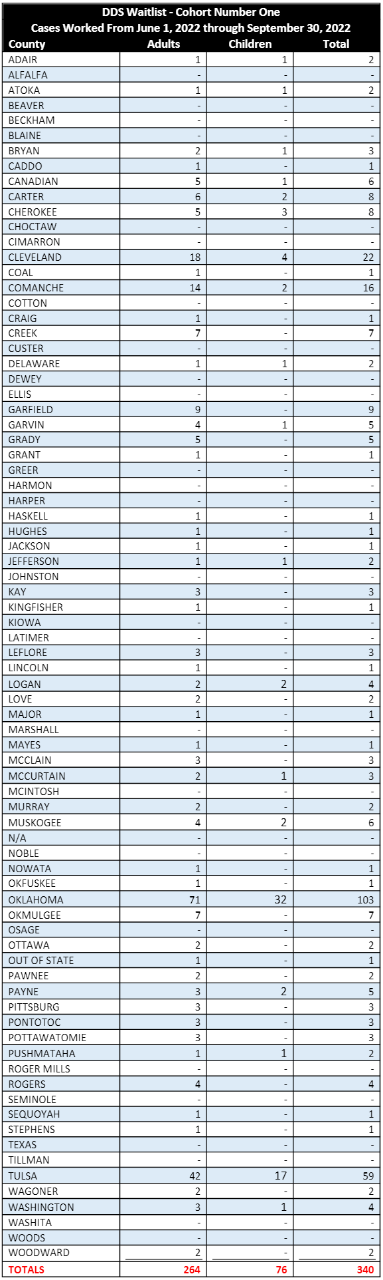
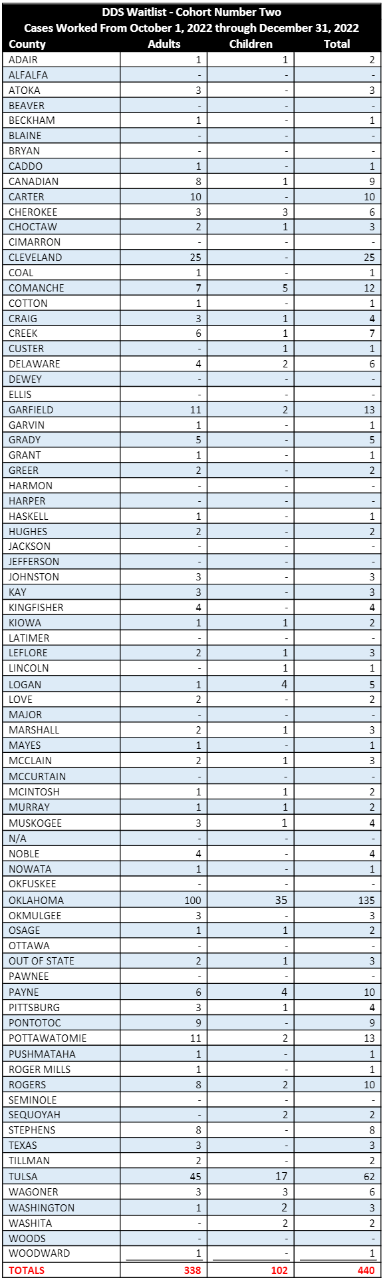
For additional detail on the cohorts illustrating the number of cases worked each quarter categorized by the number of children, adults and county of residence, see the drop down below:

Application date |
Number of applications submitted |
Processing time frame |
Applications in-process |
Applications approved |
People receiving services |
All other cases* |
February 2016-May 2019 |
899 |
Julyl 2023 until Complete |
201 |
107 | 240 | 351 |

Application date |
Number of applications submitted |
Processing time frame |
Applications in-process |
Applications approved |
People receiving services |
All other cases* |
January 2014 -January 2016 |
911 |
April 2023 until Complete |
127 |
60 | 286 | 438 |

Application date |
Number of applications submitted |
Processing time frame |
Applications in-process |
Applications approved |
People receiving services |
All other cases* |
April 2012-December 2013 |
914 |
June 2022 until Complete |
66 |
26 | 322 | 500 |

Application date |
Number of applications submitted |
Processing time frame |
Applications in-process |
Applications approved |
People receiving services |
All other cases* |
February 2011-March 2012 |
440 |
October 2022 |
10 |
10 | 183 | 237 |
Application date |
Number of applications submitted |
Processing time frame |
Applications in-process |
Applications approved |
People receiving services |
All other cases* |
April 2010-January 2011 |
340 |
June 2022 |
6 |
3 | 144 | 187 |
*See charts below for additional information

Persons Receiving Services By Waiver and Total Reimbursement as of March 31, 2024
Waiver Type |
Community |
Homeward Bound |
In-Home Support Waiver-Adults |
In-Home Support Waiver-Children |
Total |
People receiving services |
3,308 |
448 |
2,791 |
615 |
7,162 |
Year-to-date expenditures |
$227.9 million |
$62.8 million |
$34.5 million |
$1.9 million |
$327.1 million |